Contents

1.1                         Background                                                                            

1.2                         Reporting Period                                                                 

1.3                         Details of Sampling and Laboratory Testing Activities

1.4                         Details of Outstanding Sampling and/or Analysis

1.5                         Brief Discussion of the Monitoring Results for ESC CMP V    

1.6                         Activities Scheduled for the Next Month

1.7                   STUDY PROGRAMME


Annexes


Annex A       Sampling Schedule

Annex B       Water Quality Monitoring Results

Annex C       Graphical Presentations

Annex D      Study Programme


Background

1.1.1                                  The Civil Engineering and Development Department (CEDD) is managing a number of marine disposal facilities in Hong Kong waters, including the Contaminated Mud Pits (CMPs) to the South of The Brothers (SB) and to the East of Sha Chau (ESC) for the disposal of contaminated sediment, and open-sea disposal grounds located to the South of Cheung Chau (SCC), East of Tung Lung Chau (ETLC) and East of Ninepins (ENP) for the disposal of uncontaminated sediment.  Two Environmental Permits (EPs), EP-312/2008/A and EP-427/2011/A, were issued by the Environmental Protection Department (EPD) to the CEDD, the Permit Holder, on 28 November 2008 and 23 December 2011 for the Dredging, Management and Capping of Contaminated Sediment Disposal Facilities at ESC CMP V and SB CMPs, respectively.

1.1.2                                  Under the requirements of the two EPs for ESC CMP V and SB CMPs, EM&A programmes which encompass water and sediment chemistry, fisheries assessment, tissue and whole body analysis, sediment toxicity and benthic recolonisation studies as set out in the EM&A Manuals are required to be implemented.  EM&A programmes have been continuously carried out during the operation of the CMPs at ESC and SB.  A review of the collection and analysis of such environmental data from the monitoring programme demonstrated that there had not been any adverse environmental impacts resulting from disposal activities ([1]) ([2])The current programme will assess the impacts resulting from dredging, disposal and capping operations of CMP V as well as capping operations of SB CMPs.

1.1.3                                  The present EM&A programme under Agreement No. CE 63/2016 (EP) covers the dredging, disposal and capping operations of the ESC 
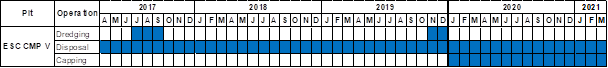
CMP V as well as the capping operations of the SB CMPs (see Annex A for the EM&A programme).  The scheduled EM&A programme for SB CMPs was completed in December 2018.  Detailed works schedule for ESC CMP V is shown in Figure 1.1.  In February 2020, the following works were undertaken:

·  Disposal of contaminated mud at ESC CMP Vb; and

·  Capping operations at ESC CMP Vd.

Figure 1.1      Works Schedule for ESC CMP V

1.2                                       Reporting Period

1.2.1                                 This Monthly EM&A Report for February 2020 covers the EM&A activities for the reporting month of February 2020.

1.3                                       Details of Sampling and Laboratory Testing Activities

1.3.1                                  The following monitoring activities were undertaken for ESC CMP V in February 2020:

·     Water Column Profiling of ESC CMP Vb;

·     Routine Water Quality Monitoring of ESC CMPs;

·     Pit Specific Sediment Chemistry of ESC CMP Vb;

·     Cumulative Impact Sediment Chemistry of ESC CMPs;

·     Sediment Toxicity Tests of ESC CMPs;

·     Demersal Trawling for ESC CMPs; and

·     Water Quality Monitoring During Capping of ESC CMPs.

1.4                                       Details of Outstanding Sampling and/or Analysis

1.4.1                                  No outstanding sampling remained for February 2020.

1.4.2                                  The following analyses are in progress and will be presented in the corresponding quarterly report:

·     Species identification of the biota samples collected from Demersal Trawling for ESC CMPs in February 2020; and

·     Sediment Toxicity Tests of ESC CMPs in February 2020.

1.5                                       Brief Discussion of the Monitoring Results for ESC CMP V

1.5.1                                  Brief discussion of the monitoring results of the following activities for ESC CMP V is presented in this Monthly EM&A Report for February 2020:

·     Water Column Profiling of ESC CMP Vb;

·     Routine Water Quality Monitoring of ESC CMPs;

·     Pit Specific Sediment Chemistry of ESC CMP Vb;

·     Cumulative Impact Sediment Chemistry of ESC CMPs; and

·     Water Quality Monitoring During Capping of ESC CMPs.


1.5.2                                  Water Column Profiling of ESC CMP Vb – February 2020

1.5.3                                  Water Column Profiling was undertaken at a total of two sampling stations (Upstream and Downstream stations) on 3 February 2020.  The monitoring results have been assessed for compliance with the Water Quality Objectives (WQOs) set by Environmental Protection Department (EPD)This consists of a review of the EPD routine water quality monitoring data for the dry season period (November to March) of 2009 - 2018 from stations in the Northwestern Water Control Zone (WCZ), where the ESC CMPs are located ([3]).  For Salinity, the averaged value obtained from the Reference (Upstream) station was used for the basis as the WQO.  Levels of Dissolved Oxygen (DO) and Turbidity were also assessed for compliance with the Action and Limit Levels (see Table B1 of Annex B for details).

In-situ Measurements

1.5.4                                 Analyses of results for February 2020 indicated that levels of Salinity, pH and DO complied with the WQOs at both Downstream and Upstream stations (Table B2 of Annex B).  Levels of DO and Turbidity at all stations complied with the Action and Limit Levels (Tables B1 and B2 of Annex B).

Laboratory Measurements for Suspended Solids (SS)

1.5.5                                  Analyses of results February 2020 indicated that the SS levels at both Downstream and Upstream stations complied with the WQO and the Action and Limit Levels (Tables B1 and B2 of Annex B).   

1.5.6                                  Overall, the monitoring results indicated that the mud disposal operation at ESC CMP Vb did not appear to cause any deterioration in water quality during this reporting period.

1.5.7                                  Routine Water Quality Monitoring of ESC CMPs February 2020

1.5.8                                  Routine Water Quality Monitoring of ESC CMPs was undertaken on 4 February 2020.  The monitoring results have been assessed for compliance with the WQOs (see Section 1.5.3 for details).  The monitoring results are shown in Tables B3 and B4 of Annex B and Figures 1 - 10 of Annex C.  A total of ten (10) monitoring stations were sampled in February 2020 as shown in Figure 1.2.

In-situ Measurements

1.5.9                                  Graphical presentation of the monitoring results (Temperature, DO, pH, Salinity and Turbidity) is shown in Figures 1 - 6 of Annex C.  Analyses of results for February 2020 indicated that the levels of pH, Salinity and DO complied with the WQOs at all stations in February 2020

1.5.10                             The levels of DO and Turbidity complied with the Action and Limit Levels at all stations (Table B3 of Annex B; Figures 3 and 6 of Annex C). 

1.5.11                              Overall, in-situ measurement results of the Routine Water Quality Monitoring indicated that the disposal operation at ESC CMP Vb did not appear to cause any unacceptable impacts in water quality in February 2020. 

Laboratory Measurements

1.5.12                              Laboratory analysis of February 2020 results indicated that concentrations of Arsenic, Cadmium, Chromium, Copper, Mercury, Lead, Nickel and Zinc were detected in February 2020 samples at most stations and the concentrations of these metals and metalloids were similar amongst the stations, except the concentrations of Zinc and Copper were higher at Reference stations and Impact stations, respectively (Table B4 of Annex B; Figure 7 of Annex C).    

1.5.13                              For nutrients, concentrations of Total Inorganic Nitrogen (TIN) at all stations were lower than the WQO (0.5 mg/L) (Table B4 of Annex B; Figure 8 of Annex C).  The concentrations of Ammonia Nitrogen (NH3-N) were higher at Ma Wan station and the concentrations of 5-day Biochemical Oxygen Demand (BOD5) were similar amongst all stations in February 2020 (Table B4 of Annex B; Figure 8 and 9 of Annex C). 

1.5.14                              Analyses of results for February 2020 indicated that the SS levels at all stations were lower than the WQO (13.6 mg/L for dry season) and complied with the Action and Limit Levels (Tables B1 and B4 of Annex B; Figure 10 of Annex C). 

1.5.15                              Overall, results of the Routine Water Quality Monitoring indicated that the disposal operation at ESC CMP Vb did not appear to cause any unacceptable deterioration in water quality in February 2020.  Detailed statistical analysis will be presented in the Quarterly Report to investigate any spatial and temporal trends of potential concern.

1.5.16                              Pit Specific Sediment Chemistry of ESC CMP Vb – February 2020

1.5.17                              Monitoring locations for Pit Specific Sediment Chemistry for ESC CMP Vb are shown in Figure 1.3.  A total of six (6) monitoring stations were sampled on 5 February 2020.  

1.5.18                              The concentrations of most inorganic contaminants were lower than the Lower Chemical Exceedance Levels (LCELs) at most stations, except for Arsenic (Figures 11 and 12 of Annex C).  The concentrations of Arsenic were higher than the LCEL at Pit-Edge stations ESC-NECA and ESC-NECB.

1.5.19                              For organic contaminants, the concentrations of Total Organic Carbon (TOC) were higher at Active-Pit stations in February 2020 (Figure 13 of Annex C).  The concentrations of Tributyltin (TBT), Total Polychlorinated Biphenyls (PCBs), Total dichloro-diphenyl-trichloroethane (DDT), 4,4’-dichlorodiphenyldichloroethylene (DDE), Low Molecular Weight and High Molecular Weight Polycyclic Aromatic Hydrocarbons (PAHs) were below the limit of reporting at all stations in February 2020. 

1.5.20                              Whilst the average concentration of Arsenic in the Earth’s crust is generally ~2mg/kg, significantly higher Arsenic concentrations (median = 14 mg/kg) have been recorded in Hong Kong’s onshore sediments ([4]).  It is presumed that the natural concentrations of Arsenic are similar in onshore and offshore sediments ([5]), and relatively high Arsenic levels may thus occur throughout Hong Kong.  Therefore, the LECL exceedances of Arsenic are unlikely to be caused by the disposal operations at ESC CMP Vb but rather as a result of naturally occurring deposits.

1.5.21                              Statistical analysis will be undertaken and presented in the corresponding quarterly report to investigate whether there are any unacceptable impacts in the area caused by the contaminated mud disposal.

1.5.22                              Cumulative Impact Sediment Chemistry of ESC CMPs – February 2020  

1.5.23                              Monitoring locations for Cumulative Impact Sediment Chemistry for ESC CMPs are shown in Figure 1.4.  A total of nine (9) monitoring stations were sampled on 6 and 7 February 2020.

1.5.24                              Analyses of results for the Cumulative Impact Sediment Chemistry Monitoring indicated that the concentrations of most inorganic contaminants were below the LCEL at most stations in February 2020, except concentrations of Arsenic were higher than the LCEL at Near-field station ESC-RNB, Mid-field stations ESC-RMA and ESC-RMB and Far-field station ESC-RFB (Figures 14 and 15 of Annex C).  As discussed in Section 1.5.20, the LECL exceedances of Arsenic are unlikely to be caused by the disposal operations at ESC CMP Vb but rather as a result of naturally occurring deposits.

1.5.25                              For organic contaminants, the concentrations of TOC varied between stations in February 2020, with the generally higher concentrations of TOC recorded at Ma Wan station (Figure 16 of Annex C).  The concentrations of TBT, Total PCBs, Total DDT, 4,4’- DDE, Low Molecular Weight and High Molecular Weight PAHs were below the limit of reporting at all stations in February 2020. 

1.5.26                              Overall, there is no evidence indicating any unacceptable environmental impacts to sediment quality as a result of the contaminated mud disposal operations at ESC CMP Vb in February 2020.  Statistical analysis will be undertaken and presented in the corresponding quarterly report to investigate whether there are any unacceptable impacts in the area caused by the contaminated mud disposal.

1.5.27                              Water Quality Monitoring during Capping of ESC CMPs February 2020

1.5.28                              The monitoring results obtained during February 2020 sampling in the dry season have been assessed for compliance with the WQOs (see Section 1.5.3 for details).  A total of sixteen (16) monitoring stations were sampled on 10 February 2020 as shown in Figure 1.5.   

In-situ Measurements

1.5.29                              Graphical presentation of the monitoring results (Temperature, DO, pH, Salinity and Turbidity) is shown in Figures 17-22 of Annex C.  Levels of Salinity, DO and pH at all stations in February 2020 complied with the WQO (Table B5 of Annex B)Level of DO and Turbidity also complied the Action and Limit levels (Table B5 of Annex B)

Laboratory Measurements for Suspended Solids (SS)

1.5.30                              Concentrations of SS complied with the WQO at most stations, except at the impact stations.  Concentrations of SS complied with the Action and Limit Levels at all stations in February 2020 (Table B5 of Annex B; Figure 23 of Annex D). 

1.5.31                              Overall, results of the Water Quality Monitoring during Capping of ESC CMPs indicated that the capping operation at ESC CMP Vd did not appear to cause any unacceptable deterioration in water quality in February 2020.  Further statistical analysis will be undertaken in the quarterly report to investigate whether the capping operations at ESC CMP Vd is causing any unacceptable deterioration in water quality of the area.  

1.6                                       Activities Scheduled for the Next Month

1.6.1                                 The following monitoring activities will be conducted in the next monthly period of March 2020 for ESC CMP V (see Annex A for the sampling schedule ([6]):

·     Water Column Profiling of ESC CMP Vb; and

·     Pit Specific Sediment Chemistry of ESC CMP Vb.

1.7                       Study Programme

1.7.1                    A summary of the Study Programme is presented in Annex D.


([1])   ERM (2013)  Final Report.  Submitted under Agreement No. CE 4/2009 (EP) Environmental Monitoring and Audit for Contaminated Mud Pit at East Sha Chau.  For CEDD.

([2])    ERM (2017)  Final Report.  Submitted under Agreement No. CE 23/2012 (EP) Environmental Monitoring and Audit for Contaminated Mud Pits to the South of The Brothers and at East Sha Chau (2012 - 2017).  For CEDD.

([3])  http://epic.epd.gov.hk/EPICRIVER/marine/?lang=en

([4])   Sewell RJ (1999) Geochemical Atlas of Hong Kong. Geotechnical Engineering Office, Government of the Hong Kong Special Administrative Region

([5])   Whiteside PGD (2000) Natural geochemistry and contamination of marine sediments in Hong Kong. In: The Urban Geology of Hong Kong (ed Page A & Reels SJ). Geological Society of Hong Kong Bulletin No. 6, p109-121

([6])   The scheduled EM&A Programme for SB CMPs was completed in December 2018.