Agreement No. CE 23/2012 (EP)
Environmental Monitoring and Audit
for Contaminated Mud Pits to the South of The Brothers
and at
35th MONTHLY PROGRESS REPORT FOR JULY
2015
1.1
Background
1.1.1
Since early 1990s,
contaminated sediment ([1])
arising from various construction works
(e.g. dredging and reclamation projects) in Hong Kong
has been disposed of at a series of seabed pits at East of Sha
Chau (ESC). In late 2008, a review
indicated that the existing and planned facilities at ESC would not be able to
meet the disposal demand after 2012.
In order to meet this demand, the Hong Kong Special Administrative
Region Government (HKSARG) decided to implement a new contained aquatic
disposal (CAD) ([2]) facility at the South of The Brothers (SB
CMPs) which had been under consideration for a number of years.
1.1.2
The environmental
acceptability of the construction and operation of the Project had been
confirmed by findings of the associated Environmental Impact Assessment (EIA)
study completed in 2005 under Agreement No. CE 12/2002(EP) ([3]). The Director of
Environmental Protection (DEP) approved this EIA report under the Environmental Impact Assessment Ordinance (Cap. 499) (EIAO) in September 2005 (EIA Register No.: AEIAR-089/2005).
1.1.3
In accordance with
the EIA recommendation, prior to commencement of construction works for the SB
CMPs, the Civil Engineering and Development Department (CEDD) undertook a
detailed review and update of the EIA findings for the SB site ([4]).
Findings of the EIA review undertaken in 2009/ 2010 confirmed that the
construction and operation of the SB site had been predicted to be
environmentally acceptable.
1.1.4
Environmental Permits (EPs) (EP-312/2008/A and EP-427/2011A) were issued by the Environmental
Protection Department (EPD) to the CEDD, the Permit Holder, on 28 November 2008
for ESC CMP V and on 23 December 2011 for SB CMPs, respectively. Under the requirements of the EPs, an Environmental
Monitoring and Audit (EM&A) programme as set out in the EM&A Manuals ([5])
([6]) is required to be implemented for the
CMPs.
1.1.5
The present
EM&A programme under Agreement No. CE 23/2012 (EP) covers the dredging, disposal and capping
operations of the SB CMPs as
well as ESC CMPs. Detailed works schedule for both CMPs is
shown in Figure
1.1. In July 2015, the following works were
being undertaken at the CMPs:
�P Capping operations at ESC CMPs;
�P Capping operations at SB CMP 1;
and
�P Disposal of contaminated mud at SB CMP 2.
Figure 1.1 Works Schedule for ESC CMPs and
SB CMPs
1.2
Reporting Period
1.2.1
This 35th Monthly Progress Report covers the EM&A
activities for the reporting month of July 2015.
1.3
Details of Sampling and Laboratory Testing Activities
1.3.1
No monitoring
activity has been
undertaken for ESC CMPs in July 2015.
1.3.2
The following monitoring activities have been undertaken for
SB CMPs in July 2015:
�P Routine Water Quality
Monitoring of CMP 2 was
undertaken on 6 July 2015;
�P Water
Column Profiling of CMP 2 was undertaken on 7 July 2015;
�P Pit
Specific Sediment Chemistry of CMP 2
was undertaken on 8 July 2015;
�P Sediment Chemistry after
a Major Storm of CMP 2 was
undertaken on 15 July 2015; and
�P Demersal Trawling was undertaken on 27 and 28 July 2015.
1.4
Details of Outstanding Sampling and/or Analysis
1.4.1
No outstanding sampling remained
for
July 2015. The following
laboratory analyses are in progress and will be presented in the corresponding
quarterly report:
�P Taxonomic identification of fishery resources
collected during Demersal Trawling for
SB CMPs on 27 and 28 July 2015.
1.4.2
A summary of field activities conducted are presented in Annex A.
1.5
Brief Discussion of the Monitoring Results for SB CMPs
1.5.1
Brief discussion of the monitoring results of the following
activities for SB CMPs is presented in this 35th Monthly Progress Report:
�P Pit Specific Sediment Chemistry of
CMP 2 in June and July 2015;
�P Cumulative
Specific Sediment Chemistry
of CMP 2 in June 2015;
�P
Routine Water Quality Monitoring of CMP 2 in July 2015;
�P
Water Column Profiling of CMP 2 in July 2015;
and
�P
Sediment Chemistry after a Major
Storm of CMP 2
in 15 July 2015.
1.5.2
Pit Specific Sediment Chemistry of
CMP 2 �V June and July
2015
1.5.3
Monitoring locations for Pit Specific Sediment Chemistry for CMP 2 are shown in Figure 1.2. A total of six
(6) monitoring stations were sampled in June and July 2015.
1.5.4
Copper exceeded the Lower Chemical Exceedance Level (LCEL) at
Active Pit station SB-NPBB in June 2015 and the Upper Chemical Exceedance
Level (UCEL) at Active Pit station SB-NPBA in June and July 2015. In addition, Silver exceeded the LCEL at Active Pit stations SB-NPBA
and SB-NPBB in June 2015 and the UCEL at Active Pit station SB-NPBA in July
2015. Exceedances of LCEL were also recorded
for Mercury at Active Pit station SB-NPBB and Zinc at Active Pit station
SB-NPBA in July 2015. The
concentrations of other inorganic contaminants (Cadmium, Chromium, Lead, Nickel and Arsenic in
June and July 2015 & Mercury and Zinc in June 2015) were lower than the
LCEL at all stations. As higher Copper, Silver, Mercury
and Zinc concentrations were recorded within the Active Pit stations only which
were receiving contaminated mud during the reporting month, there is no
evidence indicating any dispersal of contaminants from the active pit.
1.5.5
For organic contaminants, the concentrations of Total Organic Carbon
(TOC) were similar at all stations in June and July 2015. Tributyltin (TBT) concentrations were observed to be
higher at Active Pit station SB-NPBA in June and July 2015 (Figure 4 and 9 of Annex B). Low and High Molecular Weight Polycyclic
Aromatic Hydrocarbons (PAHs), Total Polychlorinated Biphenyls (PCBs), 4,4��-dichlorodiphenyldichloroethylene (DDE) and Total
dichlorodiphenyltrichloroethane (DDT) concentrations were below the limit of
reporting at most stations in June and July 2015 (except High MW PAHs at Active Pit station
SB-NPBA in June 2015 and at Active Pit stations SB-NPBA and SB-NPBB in July
2015) (Figure 5 and 10 of Annex B).
1.5.6
Overall, there is no evidence indicating any unacceptable environmental
impacts to sediment quality as a result of the contaminated mud disposal
operations at CMP 2 in June and July 2015. Statistical
analysis will be undertaken and presented in the quarterly report to
investigate whether there are any unacceptable impacts in the area caused by
the contaminated mud disposal.
1.5.7
Cumulative Impact Sediment Chemistry
of SB CMPs �V June 2015
1.5.8
Monitoring locations for Cumulative Impact Sediment Chemistry for SB CMPs are shown in Figure 1.3. A total of
eleven (11) monitoring stations were sampled in June 2015.
1.5.9
Analyses of results for the Cumulative Impact Sediment Chemistry Monitoring indicated that the concentrations
of all inorganic
contaminants were below the Lower Chemical Exceedance Level (LCEL) in June
2015 (Figures 11 and 12 of Annex B).
1.5.10
For organic
contaminants, concentration of TOC at Tai Ho Bay Station 2 (THB2) was recorded
to be higher than other stations (Figure 13 of Annex B).
Concentrations of TBTs were recorded to be higher at Near-field station
SB-RNB, Mid-field SB-RMB and Ma Wan station (Figure
14 of Annex B). Total DDT, 4,4��-DDE, Total PCBs as well as Low and High Molecular Weight PAHs were recorded below the limit of
reporting at most stations, except High Molecular Weight PAHs at Capped Pit station
SB-RCA and Tai Ho Bay Station 1 (THB1) (Figure 15 of Annex B).
1.5.11
Overall, there is no evidence indicating any unacceptable environmental
impacts to sediment quality as a result of the contaminated mud disposal
operations at CMP 2 in June 2015. Statistical
analysis will be undertaken and presented in the quarterly report to
investigate whether there are any unacceptable impacts in the area caused by
the contaminated mud disposal.
1.5.12
Routine Water Quality Monitoring of SB CMP 2 �V July 2015
1.5.13
The monitoring results for the
Routine Water Quality Monitoring conducted in July 2015 in the wet season have been
assessed for compliance with the Water Quality Objectives (WQOs) set by
EPD. This consists of a review of the EPD
routine water quality monitoring data for the wet season period (April to
October) of 2004 - 2013 from stations in the Northwestern Water
Control Zone, where the CMPs are located ([7]). For Salinity, the averaged value
obtained from the Reference stations was used for the basis as the WQO. Levels of Dissolved Oxygen (DO)
and Turbidity were also assessed for compliance with the Action and Limit
Levels (see Table C1 of Annex C for
details). The monitoring results
are shown in Figures
16-26 of Annex B and Tables C2 and C3 of Annex C. A total of twenty (20) monitoring
stations were sampled in July 2015 as shown in Figure 1.4.
In-situ Measurements
1.5.14
Graphical presentation of the monitoring results (Temperature, DO, pH,
Salinity and Turbidity) is shown in Figures 16-21 of Annex B. Analyses of results for July 2015 indicated that the levels of pH
complied with the WQOs at all stations (Impact, Intermediate, Reference and
Water Sensitive Receiver stations) in July 2015 (Figure 16 of Annex B). Levels of DO
complied with the WQO at most stations except at Reference and Tai Mo To
stations (Figures
17 and 18 of Annex B). As Tai Mo To
station is located further from the CMP 2 and a low DO level was also recorded
at Reference station, it is considered that the WQO exceedance of DO at these stations
were possibly caused by the natural background variation in water quality of
the area, instead of the disposal operation at CMP 2.
1.5.15
The levels of Salinity at Impact, Intermediate and Water
Sensitive Receiver stations exceeded the WQO range in July 2015 (Figure 20 of Annex B). The lower Salinities recorded at these
stations is likely to be caused by the freshwater discharged from the Pearl
River Delta during the summer months which tend to form a surface layer of low
salinity water at these stations with shallower depth when compared with the
Reference stations.
1.5.16
The levels of DO and Turbidity complied with the Action and
Limit Levels at all stations (Figures
18 and 21 of Annex B; Table C1 of Annex C).
1.5.17
Overall, in-situ measurement
results of the Routine
Water Quality Monitoring indicated that the disposal operation at CMP 2 did not
appear to cause any unacceptable impacts in water quality in July 2015.
Laboratory Measurements
1.5.18
Laboratory analysis of July 2015 results indicated that concentrations
of Cadmium, Chromium and Silver were below their limit of reporting at all
stations. Arsenic, Copper, Lead,
Mercury, Nickel and Zinc were detected in July 2015 samples and the
concentrations were similar amongst stations (Figures 22-23 of Annex B). Results of laboratory analysis were
shown in Table C3 of Annex C.
1.5.19
For nutrients, concentrations of Total Inorganic Nitrogen (TIN) at all
stations in July 2015 exceeded the WQO (0.5mg/L) (Figures 24 of Annex B). It is important to note that due to the effect of the Pearl River
discharges, the North Western WCZ has historically experienced higher levels of
TIN ([8]) . Therefore, the exceedances of TIN WQO at
all stations in July 2015 were unlikely to be caused by the disposal operation
at CMP 2. Ammonia Nitrogen (NH3-N)
concentration was relatively similar amongst all stations (Figures 24 of Annex B). Levels of 5-day Biochemical Oxygen Demand
(BOD5) appear to be higher at Tai Ho Bay 1 station in July 2015 (Figures 25 of Annex B).
1.5.20
Concentrations of SS exceeded the WQO (11.6 mg/L for wet
season) at Impact, Intermediate and Reference stations in July 2015. Since exceedance and higher level of SS
was also recorded at Reference station, exceedances at Impact and Intermediate
stations were considered to be due to natural background fluctuation in this
area of Hong Kong . Concentrations of SS complied with
the Action and Limit Levels at all stations in
July 2015 (Figure 26 of Annex B; Table C3 of Annex C).
1.5.21
Overall, results of the Routine Water Quality Monitoring indicated that
the disposal operation at CMP 2 did not appear to cause any unacceptable
deterioration in water quality in July 2015. Detailed
statistical analysis will be presented in the Quarterly Report to investigate
any spatial and temporal trends of potential concern.
1.5.22
Water Column Profiling of CMP 2 �V July 2015
1.5.23
Water Column
Profiling was undertaken at a total of two sampling stations (Upstream and
Downstream stations) on 7 July 2015.
The water quality monitoring results have been assessed for
compliance with the WQOs as discussed in Section
1.5.13. The monitoring
results were also compared with the Action and Limit Levels set in Baseline Monitoring Report (see Table C2 of Annex C for
details).
In-situ Measurements
1.5.24
Analyses of results for July 2015 indicated that levels of pH
complied with the WQOs at both Downstream and Upstream stations (Table C4 of Annex C). Salinity and DO at Downstream station
did not comply with the WQO. The
non-compliance of Salinity was possibly caused by the stratification of
seawater during summer when the freshwater discharged from the Pearl River
tended to form a surface layer of lower salinity water, which is probably
responsible for the lower salinity recorded at the shallower Upstream station
compared to the higher salinity recorded at the deeper Downstream station. DO and Turbidity at all stations
complied with the Action and Limit Levels and the exceedance of DO WQO at the
Downstream station thus did not appear to indicate any unacceptable water
quality impact from the mud disposal operation (Tables C1 and C4 of Annex C).
Laboratory Measurements for SS
1.5.25
Analyses of results for June 2015 indicated
that the SS levels at both Upstream and Downstream stations complied with the
WQO. Both Upstream and Downstream
stations also complied with the Action and Limit Levels (Tables C2 and C3 of Annex C).
Overall, the
monitoring results indicated that the mud disposal operation at CMP 2 did not
appear to cause any deterioration in water quality during this reporting
period.
1.5.26
Sediment Chemistry after a Major
Storm of CMP 2 �V July 2015
1.5.27
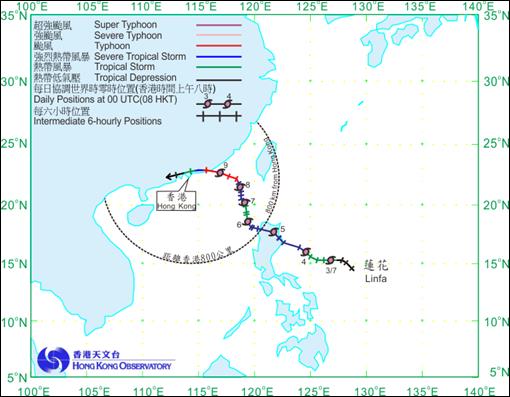
Sampling for Sediment Chemistry after a Major Storm Event was conducted
at eleven (11) monitoring stations (Figure 1.3) on 15 July 2015
after the visit of Typhoon Linfa, which led to the
issue of Gale or Storm Wind Signal No.8 on 9 July 2015. The track of Linfa
is shown in Figure 1.5.
Figure 1.5 Track of
Typhoon Linfa from 2 to 10 July 2015 (Source: Hong Kong Observatory)
1.5.28
Analyses of results for the Sediment Chemistry after a Major Storm indicated that the concentrations
of most inorganic contaminants, except Mercury, were below the LCEL (Figures 27 and 28 of Annex B). Concentration of Mercury exceeded
the LCEL at Capped Pit station SB-RCB, Near Field stations SB-RNA and RNB and Mid field station SB-RMA. As lower Mercury concentrations were
recorded at the Capped Pit stations, it is considered that the exceedances of
Mercury LCEL at these stations were unlikely to be caused by the failure of the
cap in retaining contaminated sediment within the mud pit.
1.5.29
Overall, there appeared to be no evidence showing the failure of CMPs
in retaining disposed mud or causing contamination of sediments after the major
storm event in July 2015.
1.5.30
Activities Scheduled for the Next
Month
1.5.31
The following monitoring activities will be conducted in the next
monthly period of August 2015 for SB CMPs:
�P Pit
Specific Sediment Chemistry of CMP 2;
�P Cumulative Impact
Sediment Chemistry of CMP 2;
�P Water Quality
Monitoring During Capping of CMP 1;
�P Water
Column Profiling of CMP 2;
�P Routine Water
Quality Monitoring of CMP 2;
�P Sediment
Toxicity Test of CMP 2;
�P Benthic Recolonisation Studies of CMP 1; and
�P Demersal Trawling for
SB CMPs.
1.5.32
The following monitoring activities will be conducted in the next
monthly period of August 2015 for ESC CMPs:
�P Water Quality
Monitoring During Capping of ESC CMPs; and
�P Benthic Recolonisation Studies of ESC CMPs.