Agreement No. CE 23/2012 (EP)
Environmental Monitoring and Audit
for Contaminated Mud Pits to the South of The Brothers
and at
23rd MONTHLY PROGRESS REPORT FOR july
2014
1.1
Background
1.1.1
Since early 1990s, contaminated sediment ([1])
arising
from various construction works (e.g. dredging and reclamation projects) in Hong Kong has been disposed of at a series of seabed pits
at East of Sha Chau
(ESC). In late 2008, a review indicated
that the existing and planned facilities at ESC would not be able to meet the
disposal demand after 2012. In order to
meet this demand, the Hong Kong Special Administrative Region Government
(HKSARG) decided to implement a new contained aquatic disposal (CAD) ([2])
facility at
the South of The Brothers (SB CMPs) which had been
under consideration for a number of years.
1.1.2
The environmental acceptability of the construction and
operation of the Project had been confirmed by findings of the associated
Environmental Impact Assessment (EIA) study completed in 2005 under Agreement No. CE 12/2002(EP) ([3]).
The Director of Environmental Protection (DEP) approved this EIA report
under the Environmental
Impact Assessment Ordinance (Cap. 499) (EIAO) in September 2005 (EIA Register No.: AEIAR-089/2005).
1.1.3
In accordance with the EIA recommendation, prior to
commencement of construction works for the SB CMPs, the
Civil Engineering and Development Department (CEDD) undertook a detailed review
and update of the EIA findings for the SB site ([4]). Findings of the EIA review undertaken in
2009/ 2010 confirmed that the construction and operation of the SB site had been
predicted to be environmentally acceptable.
1.1.4
Environmental
Permits (EPs)
(EP-312/2008/A and EP-427/2011A) were issued by the Environmental
Protection Department (EPD) to the CEDD, the Permit Holder, on 28 November 2008
for ESC CMP V and on 23 December 2011 for SB CMPs,
respectively. Under the requirements of
the EPs, an Environmental
Monitoring and Audit (EM&A) programme as set out in the EM&A Manuals ([5])
([6])
is required
to be implemented for the CMPs.
1.1.5
The present EM&A programme under Agreement No. CE 23/2012 (EP) covers the dredging,
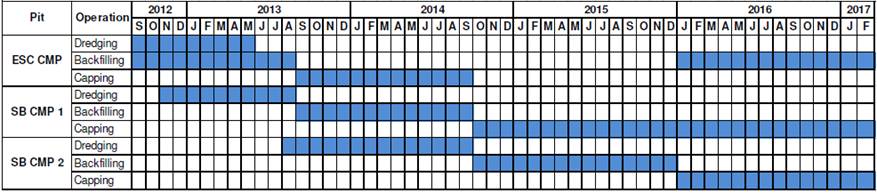
disposal and capping operations of the SB CMPs as well as ESC CMPs. Detailed works schedule for both CMPs is shown in Figure 1.1.
In July 2014, the following works were being undertaken at the CMPs:
· Capping was being undertaken at ESC CMP IVc and CMP Va;
· Disposal of contaminated mud was taking place at SB
CMP 1; and
· Dredging operations were taking place at SB CMP 2.
Figure 1.1 Works
Schedule for ESC CMPs and SB CMPs
1.2
Reporting Period
1.2.1
This 23rd
Monthly Progress Report covers the EM&A activities for the reporting month of
July 2014.
1.3
Details of Sampling and
Laboratory Testing Activities
1.3.1
No
monitoring activity was scheduled to be undertaken for ESC CMPs
in July 2014.
1.3.2
The following monitoring
activities have been undertaken for SB CMPs in July
2014:
· Impact Water
Quality Monitoring during Dredging Operations was undertaken for CMP 2 three times per week on 2, 4, 7, 9, 11, 14, 16,
21, 23, 25, 28 and 30 July 2014;
· Water
Column Profiling for CMP 1
was undertaken on 12 July 2014;
· Routine
Water Quality Monitoring for CMP
1 was undertaken on 17 July 2014;
· Pit
Specific Sediment Chemistry for CMP
1 was undertaken on 22 July 2014;
· Demersal Trawling for CMP 1 was undertaken on 30 and 31 July 2014.
1.4
Details of Outstanding Sampling and/or Analysis
1.4.1
No outstanding sampling remained
for July
2014. The following
laboratory analyses were still in progress during the preparation of this
monthly report and hence are not presented in this monthly report:
· Laboratory
analyses of sediment samples collected for Pit Specific Sediment Chemistry of CMP 1 in July
2014; and
· Identification
of Catch from Demersal Trawling
of CMP 1 and subsequent chemical analysis for the biota samples in July 2014.
1.4.2
A summary of field activities
conducted are presented in Annex
A.
1.5
Brief Discussion of the Monitoring Results for SB CMPs
1.5.1
Brief
discussion of the monitoring results of the following activities for SB CMPs is presented in this 23rd Monthly
Progress Report:
· Pit Specific Sediment
Chemistry of CMP 1 conducted
in May and June 2014;
· Cumulative Impact Sediment
Chemistry of CMP 1 conducted
in June 2014;
· Impact Water Quality
Monitoring during Dredging Operations of CMP 2 conducted in July 2014;
·
Water Column Profiling of CMP 1 conducted on 12 July 2014;
and
·
Routine Water Quality Monitoring of CMP 1 conducted on 17 July 2014.
1.5.2
Pit Specific
Sediment Chemistry of CMP 1 – May and June 2014
1.5.3
Monitoring locations for Pit Specific
Sediment Chemistry for CMP 1 are shown in Figure 1.2. A total of six (6) monitoring stations were
sampled in both May and June 2014.
1.5.4
The
concentrations of all inorganic contaminants were
lower than the Lower Chemical Exceedance Level (LCEL)
at all stations in May and June 2014 (Figures 1-2
and 5-6 of Annex B).
1.5.5
For organic contaminants, the concentration of Total
Organic Carbon (TOC) was similar amongst stations with no consistent spatial
trend in both May and June 2014 (Figures 3 and 7 of Annex
B). Concentrations of Tributyltin (TBTs) were observed
to be higher at Active Pit stations SB-NPAB and SB-NPAA in May and June 2014,
respectively (Figures
4 and 8 of Annex B). Low Molecular Weight Polycyclic Aromatic
Hydrocarbons (Low MW PAHs), High MW PAHs, Total Dichloro-Diphenyl-Trichloroethane
(DDT), 4,4’-Dichloro-Diphenyl-Dichloroethylene (4,4’-DDE) and Total
Polychlorinated Biphenyls (PCBs) were recorded below the limit of reporting at
all stations in both May and June 2014.
1.5.6
Overall, there is no evidence indicating any
unacceptable environmental impacts to sediment quality as a result of the
contaminated mud disposal operations at CMP 1 in May and June 2014.
1.5.7
Cumulative Impact
Sediment Chemistry of CMP 1 – June 2014
1.5.8
Monitoring locations for Cumulative
Impact Sediment Chemistry for CMP 1
are shown in Figure 1.3. A total of eleven (11) monitoring stations
were sampled in June 2014.
1.5.9
Analyses of results for the Cumulative Impact
Sediment Chemistry Monitoring indicated that the concentrations
of all inorganic contaminants were below the LCEL
in June
2014 (Figures 9 and
10 of Annex B).
1.5.10
For organic contaminants, concentration of TOC at Tai Ho Bay
Station 2 (THB2) was recorded to be higher than other stations (Figure 11 of Annex B). Concentrations of TBT were recorded to be
higher at Near-field station SB-RNB and Mid-field station SB-RMB (Figure 12 of Annex
B). Total DDT, 4,4’-DDE, Total PCBs as well
as Low and High MW PAHs were recorded below the limit
of reporting at all stations.
1.5.11
Overall, there is no evidence indicating any
unacceptable environmental impacts to sediment quality as a result of the
contaminated mud disposal operations at CMP 1 during this monthly period.
1.5.12
Impact Water
Quality Monitoring during Dredging Operations of CMP 2 – July 2014
1.5.13
Impact Water Quality Monitoring during Dredging
Operations of CMP 2 was conducted three times per week
from 1 to 31 July 2014 during the reporting period. On each survey day, monitoring was conducted during
both mid-ebb and mid-flood tides at two Reference (Upstream) stations and five
Impact (Downstream) stations of the dredging operations at CMP 2. Monitoring was also conducted at five
Sensitive Receiver Stations situated in Ma Wan, Shum Shui
Kok, Tai Mo To and Tai Ho Bay. A total of twelve stations were monitored and
locations of the sampling stations are shown in Figure 1.4. Monitoring at station THB2 during mid-ebb
tide of 25 July 2014 and during both mid-flood and mid-ebb tides of 14 July
2014 were cancelled due to adverse weather condition. Monitoring on 18 July 2014 at all stations
was cancelled due to adverse weather condition.
1.5.14
Monitoring results are presented in Table C1 of Annex C. Daily dredging volume in July 2014 is
reported in Annex D. Levels of DO, Turbidity and SS generally
complied with the Action and Limit Levels (see Table C2 of Annex C for
details) set in the Baseline Monitoring Report ([7]),
except for the following occasion of exceedances
discussed in Table 1.1
below.
1.5.15
As presented in Table 1.1,
the results indicated that the dredging operations at CMP 2 did not appear
to cause any unacceptable deterioration in water quality during this reporting
period. Therefore, no further mitigation
measures, except for those recommended in the Environmental Permit (EP-427/2011/A),
are considered necessary for the dredging operations.
Table 1.1 Details
of Exceedances Recorded at CMP 2 between 2 and 30 July 2014
|
Date |
Tide |
Parameter |
Station |
Type |
Remarks |
|
7 July 2014 |
Mid-Ebb |
Bottom DO |
DS2 |
Action |
These exceedances were not considered as indicating any
unacceptable impacts from the dredging operations to WSR outside the works
area due to the following reasons: · Stations
DS2, DS4, DS5, WSR45C and WSR46 are located further away from the works area
of CMP 2 when compared to station DS1 at which the levels of DOB did not
exceed the Action and Limit Levels during the same tidal period. · The lower
DO levels recorded at stations DS2, DS4, DS5, WSR45C and WSR46 during this
reporting period were possibly caused by the presence of thermocline
within the water column, as indicated by the relatively larger drop in water
temperature from the surface to the bottom water depths (see Annex E for the raw data). The thermocline
would prevent mixing of surface layer water of higher DO with water
underneath (ie at mid and bottom depths) and thus
reducing DO levels at mid and bottom depths. |
|
7 July 2014 |
Mid-Ebb |
Bottom DO |
DS4 |
Action |
|
|
7 July 2014 |
Mid-Ebb |
Bottom DO |
DS5 |
Action |
|
|
7 July 2014 |
Mid-Ebb |
Bottom DO |
WSR45C |
Action |
|
|
7 July 2014 |
Mid-Flood |
Bottom DO |
WSR45C |
Action |
|
|
16 July 2014 |
Mid-Flood |
Bottom DO |
WSR45C |
Action |
|
|
16 July 2014 |
Mid-Flood |
Bottom DO |
WSR46 |
Action |
|
|
21 July 2014 |
Mid-Ebb |
Bottom DO |
WSR45C |
Action |
|
|
9 July 2014 |
Mid-Ebb |
Bottom DO |
WSR45C |
Action |
Dredging
works were not being undertaken during these days. The Action Level exceedances
of DO and SS recorded were thus not considered as indicating any unacceptable
impacts from the dredging operations to WSR outside the works area. |
|
9 July 2014 |
Mid-Ebb |
Bottom DO |
WSR46 |
Action |
|
|
9 July 2014 |
Mid-Flood |
Bottom DO |
WSR45C |
Action |
|
|
9 July 2014 |
Mid-Flood |
Bottom DO |
WSR46 |
Action |
|
|
11 July 2014 |
Mid-Flood |
SS |
WSR45C |
Action |
|
|
14 July 2014 |
Mid-Ebb |
Surf and Mid DO |
DS3 |
Action |
|
|
14 July 2014 |
Mid-Flood |
Bottom DO |
WSR45C |
Action |