Agreement No. CE 4/2009 (EP)
Environmental Monitoring and Audit
for Contaminated Mud Pit at Sha Chau
(2009-2013) - Investigation
38th MONTHLY PROGRESS REPORTFOR CONTAMINATED MUD PITS AT SHA
CHAU August 2012
1.1
Background
1.1.1
Since 1992, the East of Sha Chau area has been the site
of a series of dredged Contaminated Mud Pits (CMPs) designed to provide
confined marine disposal capacity for contaminated mud arising from the HKSAR’s
dredging and reclamation projects.
In August 2012, the following works were being undertaken at the CMPs:
·
Capping
was being undertaken at CMP IVc;
·
Disposal
of contaminated mud was taking place at CMP Va; and
·
The
dredging of CMP Vd was in progress.
1.1.2
The Environmental Monitoring and
Audit (EM&A) programme for the CMPs at the East of Sha
Chau area (ESC) presently covers the above
operations.
1.2
Reporting Period
1.2.1
This Monthly Progress Report
covers the reporting month of August 2012.
1.3
Details of Sampling and Laboratory Testing Activities
1.3.1
The following monitoring
activities have been undertaken for CMP Va in August
2012:
·
Sediment Chemistry after a Major Storm Event
was conducted for CMP Va on 1 and 22 August 2012;
·
Pit Specific Sediment Chemistry was conducted for CMP Va
on 10 August 2012;
·
Water Column Profiling was conducted for CMP Va on 13 August 2012,
·
Demersal Trawling was conducted for CMP Va on 15 and 16 August
2012
·
Routine Water Quality Monitoring was conducted for CMP Va
on 20 August 2012;
·
Sediment Toxicity Test was conducted for CMP Va on 24 August 2012;
·
Cumulative Impact Sediment Chemistry was conducted for CMP Va
on 27 August 2012, and
·
Impact Water Quality Monitoring during Dredging Operations was conducted for CMP Vd on 29 August 2012.
1.3.2
A summary of
field activities is presented in Annex A.
1.4
Details of Outstanding Sampling and / or Analysis
1.4.1
No outstanding sampling and
laboratory analysis remained from August 2012.
1.5
Brief Discussion of the Monitoring Results for CMP V
1.5.1
Table 1.1 summarises the monitoring
results that are presented in the current monthly report. All monitoring data collected for CMP V
in August 2012 will be presented in this monthly report.
Table 1.1 Monitoring
activities in August 2012
|
Monitoring activities |
Date of Monitoring |
Monitoring results presented in this report? |
|
Sediment
Chemistry after a Major Storm Event for CMP Va |
1
and 22 August 2012 |
Yes |
|
Pit
Specific Sediment Chemistry Monitoring for CMP Va |
10
August 2012 |
Yes |
|
Water
Column Profiling for CMP Va |
13
August 2012 |
Yes |
|
Demersal Trawling for CMP Va |
15
and 16 August 2012 |
Yes |
|
Routine
Water Quality Monitoring for CMP Va |
20
August 2012 |
Yes |
|
Sediment
Toxicity Test |
24
August 2012 |
Yes |
|
Cumulative
Impact Sediment Chemistry Monitoring for CMP Va |
27
August 2012 |
Yes |
|
Impact
Water Quality Monitoring during Dredging Operations of CMP Vd |
29
August 2012 |
Yes |
1.5.2
Brief discussion of the monitoring
results is presented in this section. Detailed discussion will be presented in
the corresponding Quarterly Report.
1.5.3
Sediment Chemistry after a
Major Storm Event of CMP Va
– 1 August and 22 August 2012
1.5.4
Samplings for Sediment Chemistry after Major Storm Events were
conducted on 1 August and 22 August 2012 after the visit of Tropical Storms Vincente and Kai-tak, which led to
the issue of Typhoon Signal No. 10 on 23 & 24 July 2012 and Typhoon Signal
No. 8 on 16 August 2012 respectively.
A total of nine monitoring stations were being sampled. The tracks of Vincente
and Kai-tak are shown in Figures 1.1 and 1.2.
Figure 1.1 Track
of Typhoon Vicente from 20 to 25 July 2012 (Source: Hong Kong Observatory)
|
|
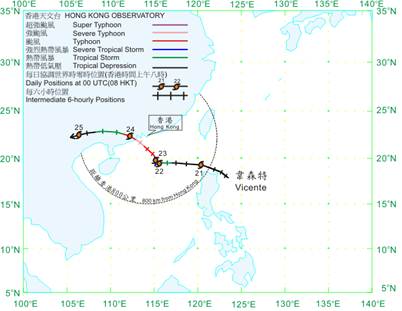
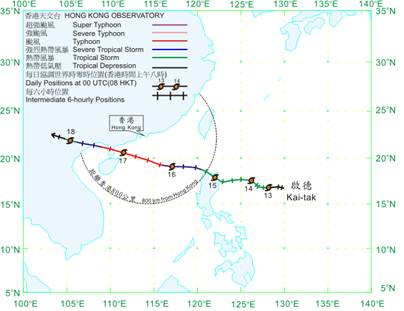
Figure 1.2 Track
of Typhoon Kai-tak from 12 to 18 August 2012 (Source:
Hong Kong Observatory)
|
|
1.5.5
Concentrations of all metals,
except Arsenic, were below the Lower Chemical Exceedance
Limit (LCEL) (Figures 1-2 and 5-6 of Annex B)
on both 1 and 22 August 2012.
Concentrations of Arsenic in sediments exceeded LCEL
(12 mg/kg) at most of the stations, but remained below Upper Chemical Exceedance Limit (UCEL) (42
mg/kg). It is important
to note that relatively high natural levels of Arsenic are present in Hong
Kong’s marine sediments. Therefore,
the slight exceedances of the LCEL for Arsenic are
unlikely to be caused by the storm events and disposal operations at CMP Va but rather as a result of naturally occurring
deposits.
1.5.6
Overall, there appeared to be no
evidence of showing the failure of CMP Va in
retaining disposed mud or causing contamination of sediments after the major
storm events in August 2012.
1.5.7
Pit Specific Sediment
Chemistry of CMP Va – August
2012
1.5.8
Monitoring locations for Pit Specific Sediment
Chemistry for CMP Va are shown in Figure 1.3. A total of six monitoring stations were
being sampled. Concentrations of metals
at all stations in August 2012 were below the LCEL, with the exception of Arsenic (Figures 8 and 9 of Annex B). Concentrations of Arsenic exceeded the
LCEL at Pit-Edge (NEDB) and Near-Pit (NNDA) stations in August 2012. As discussed in Section 1.5.5 above, the
slight exceedances of the LCEL for Arsenic are
unlikely to be caused by the disposal operations at CMP Va
but rather as a result of naturally occurring deposits.
1.5.9
For organic contaminants, Total Polychlorinated
Biphenyls (PCBs), 4,4”-Dichlorodiphenyldichloroethylene (4,4”-DDE) and total Dichlorodiphenyl-trichloroethane (DDT) were below the limit
of reporting at all stations in August 2012. Levels of Low and High Molecular Weight
Polycyclic Aromatics Hydrocarbons (Low and High M.W. PAHs) were higher than the
limit of reporting at Active Pit stations (NPDA and NPDB) and Pit-Edge station
(NEDB) in August 2012. Total
Organic Carbon (TOC) concentration was similar amongst all stations (Figure 10 of Annex B). Tributyltin
(TBT) concentration was the highest at Pit-Edge station NEDB in August 2012
when compared to other stations (Figure 11 of Annex B).
1.5.10
Overall, there is no evidence indicating any
unacceptable environmental impacts to sediment quality as a result of the
contaminated mud disposal operations at CMP Va during
this monthly period.
1.5.11
Cumulative
Impact Sediment Chemistry for CMP Va
– August 2012
1.5.12
Monitoring locations for Cumulative
Impact Sediment Chemistry for CMP Va are shown in Figure 1.4. A total of nine monitoring stations were
being sampled.
1.5.13
Analyses of results for the
Cumulative Impact Sediment Chemistry Monitoring indicated that the
concentrations of all metals, except Arsenic, were below the LCEL
(Figures
12 and 13 of Annex B). Concentrations of Arsenic in sediments
from all stations, except Near Field (RNB), exceeded the LCEL. As presented in Section 1.5.5
above, the slight exceedances of LCEL
for Arsenic do not necessarily indicate any adverse impacts to sediment
quality caused by disposal operations at CMP Va. Generally, there were only minor
differences in metal concentrations amongst the stations.
1.5.14
The concentration of TOC was
higher at the Mid Field station RMA than at other stations (Figure 14 of Annex B). TBTs were recorded in sediment samples
at Near Field (RNA), Mid Field (RMA and RMB), Capped Pit (RCA) and Ma Wan
Stations (Figure 15 of Annex B). Total DDT, 4,4”-DDE, Total PCBs, Low and
High M.W. PAHs were
below the limit of detection at all stations.
1.5.15
Overall, there is no evidence indicating any
unacceptable environmental impacts to sediment quality as a result of the
contaminated mud disposal operations at CMP Va during
this monthly period.
1.5.16
Sediment Toxicity
Test – August 2012
1.5.17
Sediment Toxicity Tests were
undertaken for sediments collected from the Near Pit, Reference and Ma Wan
stations (as shown in Figure
1.5) in August
2012 using three international species (burrowing amphipod Leptocheirus plumulosus, marine benthic polychaete
Neanthes arenaceodentata
and marine bivalave Crassostrea gigas) and two local species (barnacles Balanus amphitrite and shrimp Penaeus vannaamei). A total of five stations were being
sampled.
1.5.18
Results of the Sediment Toxicity
Tests in August
2012 showed
that the survival rates of the burrowing amphipod, bivalve, shrimp and barnacle
as well as the total dry weight of the benthic polychaete
were not significantly different between animals exposed to the sediments taken
from Near Pit, Reference and Ma Wan stations. Therefore, there did not appear to be
any evidence of adverse impacts to sediment toxicity due to the mud disposal
operations at the CMP Va of the ESC area.
1.5.19
Impact Water
Quality Monitoring during Dredging Operations of CMP Vd – August 2012
1.5.20
Impact Water Quality Monitoring during Dredging
Operations of CMP Vd was
conducted on 29 August 2012. On the survey day, sampling was
conducted during both mid-ebb and mid-flood tides at two Reference (Upstream)
stations upstream and five Impact (Downstream) stations downstream of the
dredging operations at CMP Vd (Figure 1.6). Monitoring was also conducted at Ma Wan
station. At each station, in-situ measurements
of water quality parameters as well as water samples were taken from three
depths in the water column (ie surface: 1 m below sea
surface, mid-depth and bottom: 1 m above the seabed).
1.5.21
Monitoring results are presented
in Table
C1 of Annex C. Levels of DO, Turbidity and TSS
generally complied with the Action and Limit Levels set in the Baseline
Monitoring Report ([1]), except
for Average Turbidity Level at station DS2 during mid-flood tide. The single case of exceedance
recorded at station DS2 is not likely to be caused by the dredging operations
at CMP Vd since the turbidity levels well complied
with the Action level at stations closer to dredging operations at CMP Vd (ie DS1 and DS2).
1.5.22
Overall, the results indicated
that the dredging operations at CMP Vd did not appear
to cause any unacceptable deterioration in water quality during this reporting
period. Therefore, no further
mitigation measures, except for those recommended in the Environmental Permit (EP-312/2008),
are considered required for the dredging operations of CMP Vd.
1.5.23
Routine Water Quality
Monitoring for CMP Va –
August 2012
1.5.24
The results for the Routine Water
Monitoring conducted in the wet season have been assessed for
compliance with the Water Quality Objectives (WQOs) (please see Figure 1.7
for the monitoring locations). This
consists of a review of the Environmental Protection Department (EPD) routine
water quality monitoring data for the wet season period (April to October) of
1999-2010 from stations in the Northwestern Water
Control Zone, where CMPs are located.
For Salinity, the average value obtained from the reference stations was
used for the basis as the WQO. In-situ
monitoring and laboratory results are shown in Table 1.2
and 1.3
respectively, with graphical presentation provided in Annex B. Monitoring was undertaken at a total of
sixteen stations in the reporting month.
In-situ Measurements
1.5.25
Analyses of results for August
2012 indicated that for all stations (Impact, Intermediate and Reference),
levels of pH and DO complied with the WQOs (Figures 16-18 of Annex B). Levels of Salinity complied with WQO at
all stations, except at Intermediate station (Figure 19 of Annex B). Levels of DO and Turbidity within the
reporting month complied with the Action and Limit Levels set in the EM&A Manual
([2])
(Figures 17, 18, 20 of Annex B).
All in-situ
water quality measurements showed relatively minor
variations between Impact, Intermediate and Reference stations (Figures 16 to
20 of Annex
B).
Laboratory Measurements
1.5.26
Analyses of August 2012 results
indicate that majority of metal concentrations (i.e. Cadmium, Mercury and
Silver) were below their limit of reporting at all stations. Copper and Nickel were detected in
samples from all stations. Arsenic
was detected at Impact, Intermediate and Ma Wan stations while Lead was
detected at Impact and Intermediate stations. Chromium was only detected at
Intermediate stations while Zinc was detected at Reference and Impact stations
(Figures
21 and 22 of Annex B). Concentration of Arsenic, Copper, Lead,
Nickel and Zinc appeared to be similar amongst all stations. Levels of 5-day Biochemical Oxygen
Demand (BOD5), Total Inorganic Nitrogen (TIN) and NH3-N
also appeared to be similar amongst all stations (Figures 23 and 24 of Annex B). Concentrations of TSS exceed WQO (12.74
mg/L for wet season) at Intermediate and Impact Stations while all of them
complied with the Action and Limit Levels at all stations within the reporting
month (Figure 25 of Annex B).
Table 1.2 In-situ Monitoring
Results for Routine Water Quality Monitoring during August 2012
|
Stations |
Temp |
Salinity |
Turbidity |
pH |
Dissolved Oxygen |
|
|
|
(°C) |
|
(NTU) |
|
(%) |
(mg L-1) |
|
RFE
(Reference) |
28.79 |
21.41 |
8.42 |
7.60 |
73.03 |
5.01 |
|
IPE
(Impact) |
28.96 |
21.06 |
12.79 |
7.63 |
73.37 |
5.03 |
|
INE
(Intermediate) |
28.47 |
24.05 |
9.88 |
7.68 |
75.38 |
5.12 |
|
Ma
Wan Station |
29.11 |
22.21 |
6.64 |
7.66 |
80.40 |
5.46 |
|
WQO |
N/A |
19.27-23.56 |
N/A |
6.5-8.5 |
N/A |
>4 |
|
Note: # Not exceeding 10% of natural
ambient level which is the result obtained from the Reference Station. |
||||||
Table 1.3 Laboratory
Results for Routine Water Quality Monitoring during August 2012
|
Stations |
As |
Ag |
Cd |
Cr |
Cu |
Hg |
Pb |
Ni |
Zn |
NH3-N |
TIN |
BOD5 |
TSS |
|
RFE |
1.65 |
<LOR |
<LOR |
<LOR |
2.13 |
<LOR |
<LOR |
2.80 |
5.73 |
0.08 |
0.94 |
0.70 |
10.50 |
|
IPE |
2.08 |
<LOR |
<LOR |
<LOR |
1.90 |
<LOR |
0.66 |
2.48 |
5.45 |
0.08 |
0.94 |
0.64 |
19.20 |
|
INE |
2.13 |
<LOR |
<LOR |
0.71 |
1.09 |
<LOR |
0.55 |
1.98 |
3.23 |
0.06 |
0.72 |
0.88 |
13.93 |
|
Ma Wan Station |
2.13 |
<LOR |
<LOR |
<LOR |
1.25 |
<LOR |
<LOR |
2.13 |
2.50 |
0.09 |
0.86 |
0.78 |
9.75 |
|
WQO of TSS |
12.74 |
||||||||||||
1.5.27
Overall, the results indicated
that the disposal operation at CMP Va did not appear to cause any deterioration
in water quality during this reporting period.
1.5.28
Water Column
Profiling for CMP Va – August 2012
1.5.29
Water Column Profiling was
undertaken at a total of two sampling stations in August 2012. The water quality monitoring results
have been assessed for compliance with the WQOs set by EPD as presented in Section 1.5.24
above. Graphical presentation of
the monitoring results is provided in Annex
B.
In-situ Measurements
1.5.30
Analyses of results for August 2012
indicated that levels of Salinity, pH and Dissolved Oxygen (DO) all complied
with the WQOs at both Upstream and Downstream stations (Figures 26, 27 and
28 of Annex B). DO and Turbidity complied with the
Action and Limit Levels set in the EM&A Manual ([3]).
Laboratory Measurements for Total Suspended Solids
(TSS)
1.5.31
Analyses of data obtained in August
2012 indicated that the TSS levels at Upstream and Downstream stations complied
with the WQO (Figure 29 of Annex B). TSS levels measured in August 2012
complied with the Action and Limit Levels set in the EM&A Manual.
1.5.32
Overall, the results indicated that
the mud disposal operation at CMP Va did not appear to cause any deterioration
in water quality during this reporting period.
1.5.33
Demersal
Trawling for CMP Va – August 2012
Abundance and Biomass
1.5.34
Demersal Trawling was undertaken
at a total of six sampling stations in August 2012. The average number of species collected
is presented in Table 1.4. In
August 2012, species richness was relatively similar between Impact and
Reference stations.
Table 1.4 Summary
of the Mean Number of Faunal Species Caught during August 2012
Monitoring
|
Date of Sampling |
Impact Stations |
Reference Stations |
||||
|
|
INA |
INB |
TNA |
TNB |
TSA |
TSB |
|
August 2012 |
43.4 |
45.0 |
42.4 |
42.2 |
47.4 |
42.4 |
1.6
Activities Scheduled for the
Next Month
1.6.1
The following monitoring
programmes will be conducted in the next monthly period of September 2012:
CMP V
·
Pit Specific Sediment Chemistry for CMP Va;
·
Water Column Profiling for CMP Va; and
·
Impact Water Quality Monitoring during Dredging
Operations for CMP Vd.