1
intROduction
The Hong
Kong Civil Engineering and Development
Department (CEDD) have commissioned ERM-Hong
Kong, Ltd (ERM) supported by Mr Peter Whiteside (Independent Consultant),
Halcrow China Ltd (HCL) and Professor Wen-Xiong Wang
(Independent Auditor) of the Hong Kong University of Science and Technology
(HKUST), to undertake the Environmental
Monitoring and Audit for Contaminated Mud Pits to the South of The Brothers and
at East Sha Chau (2012-2017) �V Investigation (hereafter referred as ��the
Study��). This
Study, awarded under Agreement No. CE 23/2012 (EP),
commenced on 5th September 2012.
Since December 1992, the East of Sha
Chau area has been the site of a series of dredged contaminated mud pits (CMPs)
designed to provide confined marine disposal capacity for contaminated mud arising from the HKSAR��s dredging
and reclamation projects. The
latest group of pits, CMP Va, b, c & d began receiving contaminated mud
from construction projects on 10 February 2012. CMP Va is presently in operation for
backfilling of contaminated sediments.
Capacity to dispose of contaminated
mud is currently predicted to be exhausted in 2015 with the completion of
backfilling of CMP Vd at East of Sha Chau (ESC). When CMP Vd is full, a new
environmentally acceptable disposal capacity for essential arisings will be
required. The environmental
acceptability of the construction and operation of the CMPs at the South of the
Brothers (the Project) had been confirmed by the findings of the associated EIA
study completed in 2005 under Agreement No. CE
12/2002(EP) ([1]). The Director of Environmental Protection
(DEP) approved the respective EIA report of this Agreement under the EIAO in
September 2005 (EIA Register No.: AEIAR-089/2005). A detailed EIA Review (the Review) was
carried out under Agreement No. FM 2/2009 ([2])
to re-confirm the
relevance of the findings of the approved EIA report with respect to the
up-to-date information of other concurrent projects in the vicinity or any
updated requirements/guidelines and to recommend on the environmental viability
of the proposed the South of The Brothers (SB) CMPs.
The Review concluded that relevant
findings and recommendations of the approved EIA report in relation to the SB
CMPs are still valid. An
information note advising members of the Advisory Council on the Environment
(ACE) about the Review outcome was circulated in August 2010 with no further
comments received.
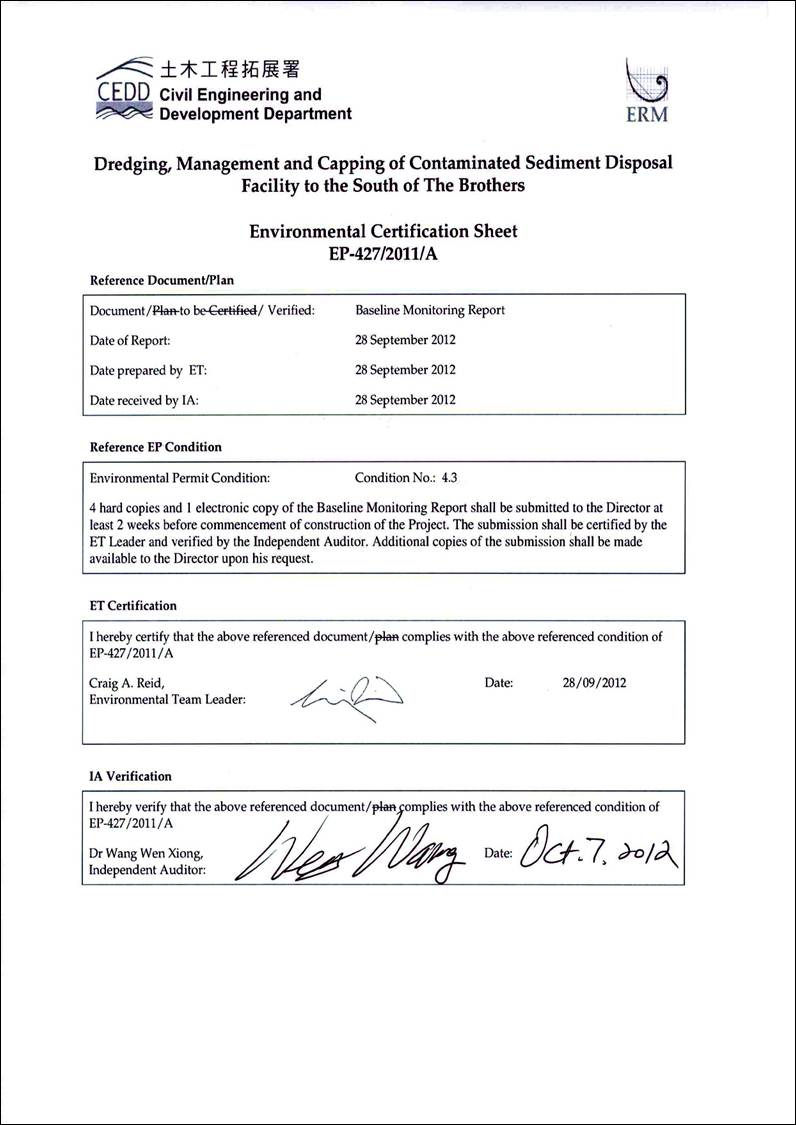
An Environmental Permit (EP-427/2011) for Dredging, Management
and Capping of Contaminated Sediment Disposal Facility to the South of The
Brothers (hereafter referred as ��the Project��) was issued by the Environmental
Protection Department (EPD) to the CEDD, the Permit Holder, on 3 November 2011
and varied on 23 December 2011 (EP-427/2011/A).
Under the requirements of Condition 4 of the EP (EP-427/2011/A), an EM&A programme as
set out in the Environmental Monitoring
and Audit Manual (EM&A Manual) is required to be implemented during
construction and operational phases of the SB CMPs. In accordance with the EM&A Manual, baseline monitoring of
water quality is required to be undertaken prior to dredging activities to form
the SB CMPs.
The purpose of this Baseline Monitoring Report is to present
baseline marine water quality at the designated monitoring locations in the
Project and reference areas prior to the commencement of marine dredging
works. These levels will be used as
the basis for compliance monitoring during dredging, backfilling and capping
activities at the SB CMPs. This
report presents the monitoring requirements, methodologies and results of the
baseline marine water quality measurements in accordance with the EM&A Manual.
After this introductory section, the
remainder of the report is structured as follows:
Section
2 : Baseline Water Quality Monitoring
Methodology
Summarises the water quality
monitoring parameters, monitoring programme, monitoring methodology, monitoring
frequency and monitoring locations.
Section
3 : Baseline Water Quality Monitoring
Results
Presents the monitoring results and establishes the
Action and Limit Levels in accordance with the EM&A Manual.
Section
4 : Conclusions
Concludes the representativeness of
the baseline monitoring results and observations for the Project.
The following Section provides details of methodology used in the
baseline monitoring of water quality prior
to the commencement of marine dredging works for the Project.
In accordance with the EM&A Manual, water quality sampling
was undertaken at monitoring stations in the vicinity of the new facility at the South of The Brothers
and in reference areas (EPD Water Quality Monitoring Stations NM1, 2, 3, 5 and
6) prior to the commencement of marine dredging works. Locations of the baseline monitoring
stations are shown in Figure 2.1. Co-ordinates of these monitoring
stations are listed in Table 2.1.
Table 2.1 Coordinates
of Water Quality Monitoring Stations for Baseline Water Quality Monitoring
|
Monitoring Stations
|
Easting
|
Northing
|
|
Far
Field Stations
|
|
|
|
SB-WFA
|
805787
|
827951
|
|
SB-WFB
|
806066
|
816537
|
|
Mid
Field Stations
|
|
|
|
SB-WMA
|
813001
|
821559
|
|
SB-WMB
|
818386
|
822120
|
|
Near
Field Stations
|
|
|
|
SB-WNAA
|
814847
|
820043
|
|
SB-WNAB
|
816197
|
819911
|
|
SB-WNBA
|
813999
|
819207
|
|
SB-WNBB
|
815505
|
819019
|
|
Reference
Stations
|
|
|
|
NM1
|
820256
|
823214
|
|
NM2
|
816015
|
823686
|
|
NM3
|
812527
|
824049
|
|
NM5
|
807707
|
827244
|
|
NM6
|
807584
|
820286
|
|
Sensitive
Receiver Stations
|
|
|
|
MW1
|
823604
|
823654
|
|
THB1
|
814514
|
817932
|
|
THB2
|
815873
|
818035
|
|
WSR45C
|
817431
|
820211
|
|
WSR46
|
813880
|
820973
|
Note: Coordinates are based on Hong Kong 1980 GRID Coordinate System
Baseline water quality monitoring was
conducted in accordance with the requirements stated in the EM&A Manual, which are presented below.
2.2.1
Monitoring Parameters
Parameters measured in situ were:
�P
Dissolved
Oxygen (mg L-1);
�P
Salinity
(ppt);
�P
pH;
�P
Turbidity
(NTU);
�P
Temperature
(�XC); and
�P
Current
Velocity and Direction (ms-1).
Parameters measured in the laboratory
were:
�P
Suspended
Solids (SS) (mg L-1);
�P
Ammonia
(mg L-1);
�P
Total
Inorganic Nitrogen (TIN mg L-1);
�P
5-Day
Biochemical Oxygen Demand (BOD5);
�P
Cadmium
(mg L-1);
�P
Chromium
(mg L-1);
�P
Copper
(mg L-1);
�P
Lead
(mg L-1);
�P
Mercury
(mg L-1);
�P
Nickel
(mg L-1);
�P
Silver
(mg L-1);
�P
Zinc
(mg L-1); and
�P
Arsenic
(mg L-1).
In addition to the water
quality parameters, other relevant data were measured and recorded in Water Quality
Monitoring Logs, including the location of the sampling stations, water depth,
time, weather conditions, sea conditions, tidal stage, special phenomena and
work activities undertaken around the monitoring and works area that may
influence the monitoring results.
2.2.2
Monitoring Frequency
Baseline water quality monitoring should be carried
out for four weeks, with the frequency of three days per week. The interval between two sets of
monitoring was not less than 36 hours.
In situ
measurements and water samples were taken during
mid-flood and mid-ebb tidal stages on each sampling occasion.
2.3.1
Monitoring Equipment
Positioning Device
A Global Positioning System (GPS) was used (C-Nav globally corrected DGPS, GPS 84 datum) during
monitoring to ensure the accurate recording of the position of the monitoring
vessel before taking measurements.
The instrument calibration was checked by recording a measured position
at a previously coordinated location on shore.
Electronic data logging
device
A data logging device capable of
storing in situ measurement data was
used. The device was able to read
and store the output from all electronic meters used for this project and
recorded time and location as measured by the GPS.
In situ Measurement
Equipment
The instrument was a portable, weatherproof
multi-parameter measuring instrument (YSI 6820) complete with cables,
multi-probe sensor, comprehensive operation manuals, and was operable from a DC
power source. It was capable of
measuring:
�P turbidity levels between 0-1000 NTU (response of
the sensor was checked with certified standard turbidity solutions before the
start of measurement);
�P pH of 0 to 14 units with a resolution of 0.01 unit;
�P dissolved oxygen levels in the range of 0 �V 50 mg L-1;
and 0-500% saturation;
�P temperature of -5 to 45 �XC; and,
�P salinity in the range of 0-40 ppt
(checked with 30 ppt Salinity solutions before the
start of the measurement).
Water Depth Gauge
An echo sounder mounted to the hull of the survey
vessel was used to measure water depth.
Current Velocity
Sea water
current velocity was measured using a Workhorse Acoustic Doppler Current
Profiler (ADCP) manufactured by Teledyne RD Instruments. This instrument measured current speed
and direction in 1 m vertical increments below the survey vessel, from just
below the sea surface to just above the seabed.
Water Sampling Equipment
Water samples for suspended solids measurement were
collected by the use of a multi-bottle water sampling
system (General Oceanics Inc., Rosette Sampler
ROS02), consisting of PVC bottles of more than two litres,
which could be effectively sealed with cups at both ends. The water sampler had a positive
latching system to keep it open and prevent premature closure until released by
a messenger when the sampler was at the selected water depth.
2.3.2
Monitoring Methodology
Timing
& Frequency
Water quality sampling was undertaken
within a 4-hour window of 2 hours before or after mid-flood and mid-ebb
tides. Tidal range for flood and
ebb tides was not less than 0.5 m for capturing representative tides.
Reference was made to the predicted tides at Chek Lap Kok, which is the tidal
station nearest to the Project site, published on the website of Hong Kong
Observatory (). Based
on the predicted water levels at Chek Lap Kok, the baseline water quality monitoring was conducted
between 26 July and 23 August 2012, following the schedule presented in Annex A. It
should be noted that on 16 August 2012, monitoring was cancelled due to adverse
weather conditions caused by the typhoon Kai Tak
which led to the issue of Typhoon Signal No. 8 by the Hong Kong Observatory
during the survey time. As a
result, baseline monitoring was undertaken over a period of five (5) weeks
during which twelve (12) sampling events were conducted.
Triplicate samples were collected from each of the
monitoring events for in situ measurements and laboratory analysis.
Depths
Each station was sampled and measurements were
taken at three depths, 1 m below the sea surface, mid depth and 1 m above the
sea bed. Where the water depth was
less than 6 m, the mid-depth station was omitted. For stations that were less than 3 m in
depth, only the mid depth sample was taken.
Protocols
The multi-parameter measuring instruments (YSI
6820) were checked and calibrated by an HOKLAS accredited laboratory before use
(see calibration reports in Annex B). Onsite calibration was also carried out
to check the responses of sensors and electrodes using certified standard
solutions before each use.
Sufficient stocks of spare parts were maintained for replacements when
necessary, and backup monitoring equipment was made available.
Water samples were collected in high density
polythene bottles, packed in ice (cooled to 4�X C without being frozen), and
delivered to HOKLAS accredited laboratory as soon as possible after collection for immediate analysis.
Laboratory Analysis
All laboratory work was carried out by HOKLAS
accredited laboratory. Water
samples were collected at the monitoring and reference stations for carrying
out the laboratory determinations.
The determination work started within the next working day after
collection of the water samples.
For laboratory analysis, the Quality Assurance /
Quality Control (QA/QC) details were in accordance with requirements of HOKLAS
or another internationally accredited scheme (details refer to Annex C).
3
Baseline
Water Quality Monitoring Results
This Section presents the results of
the baseline monitoring of water quality for the Project.
Monitoring data and graphical
presentations are summarised in Annex D.
No major activities influencing the
water quality were identified during the monitoring period.
The Action and Limit Levels for DO,
turbidity and SS were set in the EM&A
Manual and the proposed Action and Limit Levels were determined as shown in
Table 3.1.
The Action and Limit Levels of DO,
turbidity and SS are derived from the baseline monitoring data for all
stations, and the results are presented in Table
3.2.
Table 3.1 Determination
of Action and Limit Level of Water Quality for Dredging, Backfilling and
Capping Activities
|
Parameter
|
Action Level
|
Limit Level
|
|
Dissolved Oxygen
|
|
|
|
Surface
and Middle Depth Averaged
|
The
average of the impact, WSR 45C and WSR 46 station readings are < 5%ile of
baseline data
and
Significantly
less than the reference stations mean DO (at the same tide of the same day)
|
The
average of the impact, WSR 45C and WSR 46 station readings are < 4 mg L-1
and
Significantly
less than the reference stations mean DO (at the same tide of the same day)
|
|
Bottom
|
The
average of the impact, WSR 45C and WSR 46 station readings are < 5%ile of
baseline data
and
Significantly
less than the reference stations mean DO (at the same tide of the same day)
|
The
average of the impact, WSR 45C and WSR 46 station readings are < 2 mg L-1
and
Significantly
less than the reference stations mean DO (at the same tide of the same day)
|
|
Suspended Solids
|
|
|
|
Depth
Averaged
|
The
average of the impact, WSR 45C and WSR 46 station readings are > 95%ile of
baseline data
and
120%
or more of the reference stations SS (at the same tide of the same day)
|
The
average of the impact, WSR 45C and WSR 46 station readings are > 99%ile of
baseline data
and
130%
or more of the reference stations SS (at the same tide of the same day)
|
|
Turbidity
|
|
|
|
Depth
Averaged
|
The
average of the impact, WSR 45C and WSR 46 station readings are > 95%ile of
baseline data
and
120%
or more of the reference stations turbidity (at the same tide of the same
day)
|
The
average of the impact, WSR 45C and WSR 46 station readings are > 99% of
baseline data
and
130%
or more of the reference stations turbidity (at the same tide of the same
day)
|
Table 3.2 Proposed
Action and Limit Levels of Water Quality for Dredging, Backfilling and Capping
Activities
|
Parameter
|
Action
Level
|
Limit
Level
|
|
Dissolved Oxygen (DO) (1)
|
Surface and Mid-depth (2)
|
Surface and Mid-depth (2)
|
|
|
The
average of the impact, WSR 45C and WSR 46 station readings are < 5%-ile of baseline data for surface and middle layer = 4.32
mg L-1
and
Significantly
less than the reference stations mean DO (at the same tide of the same day)
|
The
average of the impact, WSR 45C and WSR 46 station readings are < 4 mg L-1
and
Significantly
less than the reference stations mean DO (at the same tide of the same day)
|
|
|
|
|
|
|
Bottom
|
Bottom
|
|
|
The
average of the impact, WSR 45C and WSR 46 station readings are < 5%-ile of baseline data for bottom layers = 3.12 mg L-1
and
Significantly
less than the reference stations mean DO (at the same tide of the same day)
|
The
average of the impact station, WSR 45C and WSR 46 readings are < 2 mg L-1
and
Significantly
less than the reference stations mean DO (at the same tide of the same day)
|
|
|
|
|
|
Depth-averaged Suspended Solids (SS) (3)
(4)
|
The
average of the impact, WSR 45C and WSR 46 station readings are > 95%-ile of baseline
data for depth average = 21.60 mg
L-1
and
|
The
average of the impact, WSR 45C and WSR 46 station readings are > 99%-ile of baseline
data for depth average = 40.10 mg
L-1
and
|
|
|
120%
of control station's SS at the same tide of the same day
|
130%
of control station's SS at the same tide of the same day
|
|
|
|
|
|
Depth-averaged Turbidity (Tby) (3) (4)
|
The
average of the impact, WSR 45C and WSR 46 station readings are > 95%-ile of baseline
data = 25.04 NTU
and
|
The
average of the impact, WSR 45C and WSR 46 station readings are > 99%-ile of baseline
data = 32.68 NTU
and
|
|
|
120%
of control station's Tby at the same tide of the same day
|
130%
of control station's Tby at the same tide of the same day
|
|
|
|
|
|
Notes:
(1) For
DO, non-compliance of the water quality limits occurs when monitoring result
is lower than the limits.
(2) The
Action and Limit Levels for DO for Surface & Middle layers were
calculated from the combined pool of baseline surface layer data and baseline
middle layer data.
(3) ��Depth-averaged��
is calculated by taking the arithmetic means of reading of all three depths.
(4) For
turbidity and SS, non-compliance of the water quality limits occurs when
monitoring result is higher than the limits.
|
4
Conclusion
Baseline water quality monitoring was
conducted between 26 July and 23 August 2012 at eighteen designated monitoring
stations established for the Project.
The monitoring was carried out 3 days per week, at mid-flood and mid-ebb
tides, at three depths (surface, middle and bottom), for 5 weeks prior to the
commencement of dredging works in accordance with the Environmental Monitoring
and Audit Manual for the Project.
No major activities were noted during baseline monitoring. Water quality monitoring results are,
therefore, representative of the baseline conditions for the Project.
Results have been used to determine
Action and Limit Levels for the dissolved oxygen, suspended solids and
turbidity for impact monitoring to be conducted during dredging, backfilling
and capping activities of the two seabed pits for the new facility at the South
of The Brothers. The proposed Action and Limit Levels for DO, SS and Turbidity
listed in Table 4.1 below will be
adopted for impact monitoring during dredging, backfilling and capping
activities of the Project.
Table 4.1 Proposed Action and Limit
Levels of Water Quality for Dredging, Backfilling and Capping Activities
|
Parameter
|
Action
Level
|
Limit
Level
|
|
Dissolved Oxygen (DO) (1)
|
Surface and Mid-depth (2)
|
Surface and Mid-depth (2)
|
|
|
The
average of the impact, WSR 45C and WSR 46 station readings are < 5%-ile of baseline data for surface and middle layer = 4.32
mg L-1
and
Significantly
less than the reference stations mean DO (at the same tide of the same day)
|
The
average of the impact, WSR 45C and WSR 46 station readings are < 4 mg L-1
and
Significantly
less than the reference stations mean DO (at the same tide of the same day)
|
|
|
|
|
|
|
Bottom
|
Bottom
|
|
|
The
average of the impact, WSR 45C and WSR 46 station readings are < 5%-ile of baseline data for bottom layers = 3.12 mg L-1
and
Significantly
less than the reference stations mean DO (at the same tide of the same day)
|
The
average of the impact station, WSR 45C and WSR 46 readings are < 2 mg L-1
and
Significantly
less than the reference stations mean DO (at the same tide of the same day)
|
|
|
|
|
|
Depth-averaged Suspended Solids (SS) (3)
(4)
|
The
average of the impact, WSR 45C and WSR 46 station readings are > 95%-ile of baseline
data for depth average = 21.60 mg
L-1
and
|
The
average of the impact, WSR 45C and WSR 46 station readings are > 99%-ile of baseline
data for depth average = 40.10 mg
L-1
and
|
|
|
120%
of control station's SS at the same tide of the same day
|
130%
of control station's SS at the same tide of the same day
|
|
|
|
|
|
Depth-averaged Turbidity (Tby) (3) (4)
|
The
average of the impact, WSR 45C and WSR 46 station readings are > 95%-ile of baseline
data = 25.04 NTU
and
|
The
average of the impact, WSR 45C and WSR 46 station readings are > 99%-ile of baseline
data = 32.68 NTU
and
|
|
|
120%
of control station's Tby at the same tide of the
same day
|
130%
of control station's Tby at the same tide of the
same day
|
|
|
|
|
|
Notes:
(1) For
DO, non-compliance of the water quality limits occurs when monitoring result
is lower than the limits.
(2) The
Action and Limit Levels for DO for Surface & Middle layers were
calculated from the combined pool of baseline surface layer data and baseline
middle layer data.
(3) ��Depth-averaged��
is calculated by taking the arithmetic means of reading of all three depths.
(4) For
turbidity and SS, non-compliance of the water quality limits occurs when
monitoring result is higher than the limits.
|